The Philadelphia Eagles and Minnesota Vikings delivered an exciting NFL matchup on October 19, 2025, at U.S. Bank Stadium in Minneapolis. Philadelphia came away with a 28–22 victory after combining an outstanding passing performance from Jalen Hurts with two important interceptions by its defense.
The game featured big plays from DeVonta Smith and A.J. Brown, productive receiving performances from Minnesota’s Jordan Addison, and a strong rushing contribution from Jordan Mason. Although the Vikings gained more total yards and controlled possession for longer, the Eagles converted their opportunities into touchdowns more effectively.
For fans researching philadelphia eagles vs minnesota vikings match player stats, this article breaks down the final score, quarterback numbers, rushing and receiving performances, defensive contributions, team statistics, and the moments that influenced the outcome.
All player statistics below refer to the October 19, 2025, regular-season game, rather than a prediction or an unverified upcoming matchup. The figures are based on the official NFL game summary and the Philadelphia Eagles’ published box score.
1. Philadelphia Eagles vs Minnesota Vikings: Match Summary
| Game detail | Result |
|---|---|
| Final score | Eagles 28, Vikings 22 |
| Philadelphia points | 28 |
| Minnesota points | 22 |
| Winning team | Philadelphia Eagles |
| Venue | U.S. Bank Stadium |
| Eagles quarterback | Jalen Hurts |
| Vikings quarterback | Carson Wentz |
Philadelphia scored seven points in each quarter, producing a consistent offensive performance. Minnesota scored three points in the first quarter, three in the second, ten in the third, and six in the fourth.
The six-point final margin reflected a competitive game, but the Eagles made better use of their biggest opportunities. Hurts threw three touchdown passes without an interception, while Philadelphia’s defense intercepted Wentz twice and returned one of those interceptions for a touchdown.
Minnesota actually finished with more total offensive yards and more first downs. However, those advantages did not translate into more points because the Vikings struggled to finish drives and committed costly turnovers.
The official Philadelphia Eagles game box score provides the detailed statistics for the contest.
2. Jalen Hurts Passing Stats
Jalen Hurts delivered one of his most efficient performances of the game, completing 19 of 23 passes for 326 yards and three touchdowns.
| Passing statistic | Jalen Hurts |
|---|---|
| Completions | 19 |
| Pass attempts | 23 |
| Completion percentage | 82.6% |
| Passing yards | 326 |
| Passing touchdowns | 3 |
| Interceptions | 0 |
| Sacks taken | 3 |
| Longest completion | 79 yards |
| Passer rating | 158.3 |
Hurts completed approximately 82.6% of his passes, giving Philadelphia an efficient way to move the ball despite a relatively quiet rushing attack.
His three touchdown passes went to A.J. Brown twice and DeVonta Smith once. The connection with Smith was especially important because it produced a 79-yard touchdown, one of the game’s biggest offensive plays.
Hurts also protected the football. Although Minnesota recorded three sacks, the Eagles quarterback did not throw an interception.
His passing performance helped Philadelphia turn its opportunities into touchdowns instead of relying heavily on field goals. A perfect passer rating of 158.3 reflected the efficiency of his performance.
Hurts recorded four rushing attempts for minus-10 yards, so his primary contribution came through the air rather than on the ground.
3. Carson Wentz Passing Stats
Carson Wentz threw for 313 yards, but his performance was less efficient than Hurts’ because he failed to record a passing touchdown and threw two interceptions.
| Passing statistic | Carson Wentz |
|---|---|
| Completions | 26 |
| Pass attempts | 42 |
| Completion percentage | 61.9% |
| Passing yards | 313 |
| Passing touchdowns | 0 |
| Interceptions | 2 |
| Sacks taken | 2 |
| Longest completion | 40 yards |
| Passer rating | 64.9 |
Wentz attempted 42 passes, compared with Hurts’ 23, yet finished with fewer passing yards and no passing touchdowns.
That difference illustrates why passing volume does not always equal offensive effectiveness. Minnesota moved the ball through the air, but the offense struggled to turn its opportunities into touchdowns.
The two interceptions were particularly costly. Philadelphia converted one into a defensive touchdown, creating a seven-point swing without requiring the offense to complete a scoring drive.
Wentz also took two sacks for a loss of 15 yards. He added 28 rushing yards on four carries, but those gains could not offset the impact of the turnovers.
The main difference between the quarterbacks was efficiency. Hurts produced three touchdown passes and protected the ball, while Wentz accumulated yardage but could not finish drives through the air.
4. Philadelphia Eagles Rushing Stats
Philadelphia’s running game was less productive than its passing attack. The Eagles finished with 45 rushing yards on 23 attempts, averaging just 2.0 yards per carry.
| Player | Carries | Rushing yards | Average | Touchdowns |
|---|---|---|---|---|
| Saquon Barkley | 18 | 44 | 2.4 | 0 |
| Tank Bigsby | 1 | 11 | 11.0 | 0 |
| Jalen Hurts | 4 | -10 | -2.5 | 0 |
| Team total | 23 | 45 | 2.0 | 0 |
Saquon Barkley led Philadelphia with 44 rushing yards on 18 carries. Although he handled most of the team’s rushing workload, Minnesota limited his ability to generate consistent gains.
Tank Bigsby contributed 11 yards on his only rushing attempt, providing one of the Eagles’ most productive individual runs by average.
Hurts’ negative rushing total reduced the team’s overall production on the ground. Nevertheless, Philadelphia’s passing game compensated for its struggles running the football.
This performance demonstrates that an offense can win without dominating every statistical category. The Eagles found ways to create explosive passing plays even when their rushing attack was not producing consistent yardage.
5. Minnesota Vikings Rushing Stats
Minnesota finished with 89 rushing yards on 23 attempts, averaging 3.9 yards per carry. Jordan Mason led the Vikings’ rushing attack and scored their only rushing touchdown.
| Player | Carries | Rushing yards | Longest run | Touchdowns |
|---|---|---|---|---|
| Jordan Mason | 15 | 57 | 12 yards | 1 |
| Carson Wentz | 4 | 28 | 16 yards | 0 |
| Zavier Scott | 4 | 4 | 5 yards | 0 |
| Team total | 23 | 89 | — | 1 |
Mason carried the ball 15 times for 57 yards and scored a rushing touchdown. His contribution helped Minnesota produce more rushing yards than Philadelphia.
Wentz added 28 yards on four attempts, including a 16-yard run. Scott finished with four carries for four yards.
The Vikings’ ground game was reasonably productive compared with Philadelphia’s, but the team still struggled to turn its overall offensive production into enough points to win.
The difference came down to finishing drives and avoiding mistakes. Minnesota could gain yards, but Philadelphia’s defense created turnovers at critical moments.
6. Philadelphia Eagles Receiving Stats
Philadelphia’s receivers were the biggest stars of the passing game. DeVonta Smith and A.J. Brown combined for 304 receiving yards and all three of Hurts’ passing touchdowns.
| Player | Receptions | Targets | Receiving yards | Average per catch | Touchdowns |
|---|---|---|---|---|---|
| DeVonta Smith | 9 | 11 | 183 | 20.3 | 1 |
| A.J. Brown | 4 | 6 | 121 | 30.3 | 2 |
| Dallas Goedert | 3 | 3 | 18 | 6.0 | 0 |
| Will Shipley | 1 | 1 | 7 | 7.0 | 0 |
| Tank Bigsby | 1 | 1 | -1 | -1.0 | 0 |
| Saquon Barkley | 1 | 1 | -2 | -2.0 | 0 |
| Team total | 19 | 23 | 326 | 17.2 | 3 |
DeVonta Smith’s standout performance
Smith led all players in receiving yards with 183 on nine catches. He averaged 20.3 yards per reception and scored one touchdown.
His 79-yard touchdown reception was a major highlight. It showed how quickly Philadelphia could move the ball downfield and punish defensive coverage mistakes.
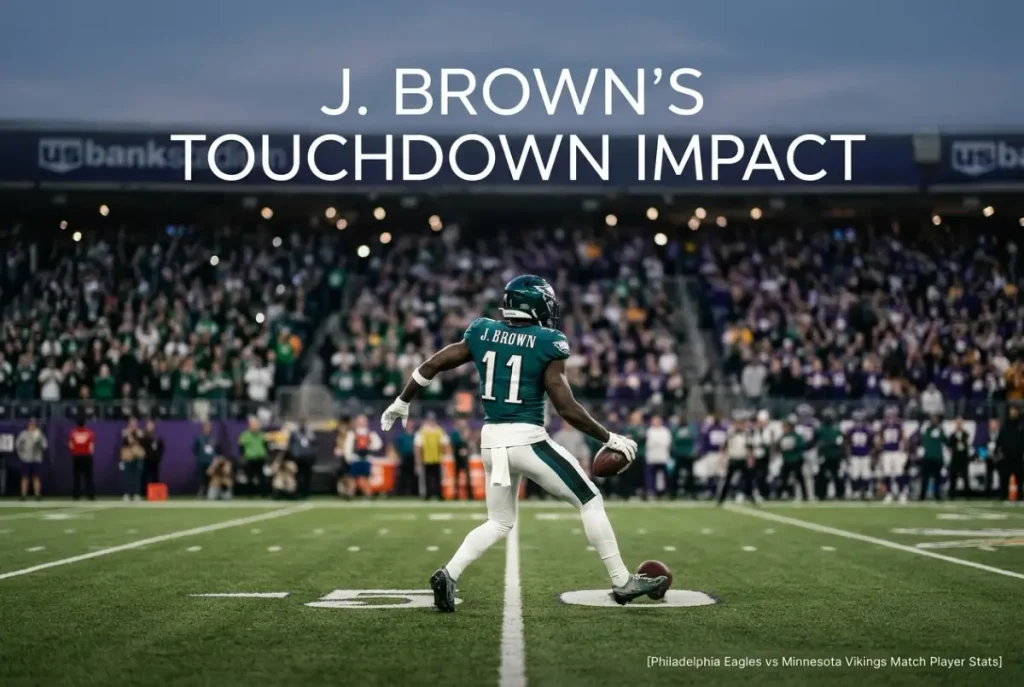
A.J. Brown’s touchdown impact
Brown recorded four catches for 121 yards and two touchdowns. His average of 30.3 yards per reception reflected the explosive nature of his production.
Both of his touchdown catches helped Philadelphia convert its passing opportunities into points. Brown’s ability to generate big gains made him a major part of the Eagles’ winning performance.
Supporting receivers
Dallas Goedert caught all three of his targets for 18 yards, while Shipley added one reception for seven yards.
Although the supporting numbers were modest, Philadelphia did not need every receiver to produce a large statistical total. Smith and Brown provided most of the explosive plays.
7. Minnesota Vikings Receiving Stats
Minnesota also had several productive receivers, led by Jordan Addison. However, none of the Vikings’ receivers scored a touchdown in the game.
| Player | Receptions | Targets | Receiving yards | Longest catch | Touchdowns |
|---|---|---|---|---|---|
| Jordan Addison | 9 | 12 | 128 | 34 yards | 0 |
| Justin Jefferson | 5 | 10 | 79 | 40 yards | 0 |
| T.J. Hockenson | 6 | 9 | 43 | 10 yards | 0 |
| Jalen Nailor | 2 | 4 | 37 | 26 yards | 0 |
| Adam Thielen | 1 | 2 | 10 | 10 yards | 0 |
| Josh Oliver | 1 | 1 | 9 | 9 yards | 0 |
| C.J. Ham | 1 | 1 | 5 | 5 yards | 0 |
| Zavier Scott | 1 | 1 | 2 | 2 yards | 0 |
| Team total | 26 | 42 | 313 | — | 0 |
Addison led Minnesota with 128 receiving yards on nine catches. His production helped the Vikings maintain their passing volume and move the ball downfield.
Justin Jefferson added 79 yards on five receptions. His longest catch covered 40 yards, but he did not score a touchdown.
T.J. Hockenson contributed six catches for 43 yards, giving Wentz another option in the passing game.
The major issue was finishing drives. Minnesota’s receivers gained yardage, but the Vikings failed to record a passing touchdown. That made the Eagles’ explosive scoring plays and defensive touchdown even more important.
8. Defensive Player Stats and Key Plays
Defense played a major role in Philadelphia’s victory. The Eagles recorded two interceptions, including one returned for a touchdown, while Minnesota’s defense recorded three sacks.
| Defensive category | Eagles | Vikings |
|---|---|---|
| Interceptions recorded | 2 | 0 |
| Sacks recorded | 2 | 3 |
| Interception-return touchdowns | 1 | 0 |
| Opponent turnovers lost | 2 | 0 |
Jalyx Hunt intercepted a Wentz pass and returned it 42 yards for a touchdown. The play gave Philadelphia seven points and helped create the final six-point margin.
Andrew Mukuba recorded the Eagles’ other interception. Those two takeaways were crucial because they ended Minnesota possessions and gave Philadelphia additional opportunities to score.
Minnesota’s pass rush also made an impact by recording three sacks. However, the Vikings did not force a turnover from Philadelphia’s offense.
The defensive difference was not simply about the number of sacks. Philadelphia turned its opportunities into a defensive touchdown, while Minnesota could not generate a similar scoring play.
9. Team Statistics Comparison
The overall numbers show why this game was more competitive than the final score might suggest.
| Team statistic | Eagles | Vikings |
|---|---|---|
| Total offensive yards | 361 | 387 |
| Passing yards | 326 | 313 |
| Rushing yards | 45 | 89 |
| First downs | 13 | 21 |
| Third-down conversions | 3 of 10 | 7 of 15 |
| Third-down percentage | 30.0% | 46.7% |
| Turnovers lost | 0 | 2 |
| Time of possession | 25:58 | 34:02 |
| Final score | 28 | 22 |
Minnesota gained 387 total yards, compared with Philadelphia’s 361. The Vikings also recorded 21 first downs, eight more than the Eagles.
Minnesota controlled the ball for 34 minutes and two seconds, while Philadelphia held possession for 25 minutes and 58 seconds.
Despite those advantages, the Vikings lost because Philadelphia made better use of its scoring opportunities and avoided turnovers.
The Eagles were particularly effective in the passing game, averaging 7.4 yards per offensive play compared with Minnesota’s 5.8. Their explosive passing plays helped compensate for their limited rushing production.
The Vikings’ two interceptions were among the most important statistical differences. One became a defensive touchdown, directly affecting the final score.
These figures show why total yards and time of possession should not be used alone to evaluate a team’s performance.

10. Red-Zone Efficiency and Scoring Opportunities
Red-zone performance is another important way to understand the outcome.
Philadelphia recorded no successful red-zone touchdown on its one listed red-zone opportunity, while Minnesota scored one touchdown on six red-zone opportunities according to the official team statistics.
These numbers require context because not every scoring drive reaches the red zone, and the Eagles scored through explosive passing plays and a defensive interception return.
The Vikings’ inability to convert more of their possessions into touchdowns was costly. Even though Minnesota produced more first downs and total yards, it finished with only 22 points.
Philadelphia’s passing efficiency and defensive scoring helped the team overcome its limited ground game.
When evaluating future games between these teams, red-zone efficiency, third-down performance, and turnovers should be considered together. Each statistic explains a different part of how a team converts opportunities into points.
11. What Decided the Game?
Three factors stood out in the Eagles’ 28–22 victory.
1. Explosive passing plays
Hurts completed 19 passes for 326 yards and three touchdowns. Smith and Brown combined for 304 receiving yards, giving Philadelphia the ability to score quickly without relying on long drives.
2. Turnover advantage
The Eagles intercepted Wentz twice and did not turn the ball over themselves. Hunt’s interception return for a touchdown was especially important because it provided points without requiring the offense to gain additional yards.
3. Better scoring efficiency
Minnesota gained more yards and recorded more first downs, but Philadelphia converted its passing opportunities into touchdowns. The Vikings’ passing game produced 313 yards without a touchdown pass.
This contrast highlights an important lesson for NFL fans: the team with more yards does not always win. Explosive plays, turnovers, and the ability to finish drives can matter more than total offensive production.
12. Head-to-Head Context
The Eagles and Vikings have met in several memorable regular-season and postseason games. Their history includes Philadelphia’s NFC Championship Game victory in January 2018 and other competitive meetings in recent seasons.
In their October 19, 2025, regular-season meeting, Philadelphia won 28–22 in Minnesota.
Historical results are useful for understanding the rivalry, but they should not be used as the only basis for predicting a future result. Player rosters, quarterback situations, coaching decisions, and injuries change from season to season.
Fans looking for an all-time head-to-head record should check a reliable game-history database and verify the dates and scores before publishing exact totals.
13. Frequently Asked Questions
Who won the Eagles vs Vikings game on October 19, 2025?
The Philadelphia Eagles defeated the Minnesota Vikings 28–22 at U.S. Bank Stadium in Minneapolis.
How many passing yards did Jalen Hurts record?
Hurts completed 19 of 23 passes for 326 yards, three touchdowns, and no interceptions.
How many passing yards did Carson Wentz record?
Wentz completed 26 of 42 passes for 313 yards, no passing touchdowns, and two interceptions.
Who led the Eagles in receiving yards?
DeVonta Smith led Philadelphia with 183 receiving yards on nine catches and scored one touchdown.
How many receiving yards did A.J. Brown have?
Brown recorded 121 receiving yards on four catches and scored two touchdowns.
Who led the Vikings in receiving yards?
Jordan Addison led Minnesota with 128 receiving yards on nine receptions.
Who led the Vikings in rushing?
Jordan Mason led Minnesota with 57 rushing yards on 15 carries and scored one rushing touchdown.
Which team had more total yards?
Minnesota gained 387 total yards, while Philadelphia gained 361. However, the Eagles won because they were more effective at scoring and capitalized on defensive turnovers.
Where can I find the official box score?
Visit the Philadelphia Eagles official game page or the NFL statistics website for game details and other NFL statistics.
Conclusion
The October 19, 2025, matchup between Philadelphia and Minnesota demonstrated how passing efficiency and defensive turnovers can outweigh advantages in total yardage and time of possession.
Jalen Hurts threw three touchdown passes for the Eagles, DeVonta Smith recorded 183 receiving yards, and A.J. Brown added two touchdown catches. Philadelphia’s defense also intercepted Carson Wentz twice, with Jalyx Hunt returning one interception for a touchdown.
Minnesota produced more total yards, first downs, and possession time, but the Vikings could not convert enough of their opportunities into points. The final score was Philadelphia 28, Minnesota 22.
For readers researching philadelphia eagles vs minnesota vikings match player stats, the key takeaway is that the Eagles won through explosive passing plays, efficient quarterback execution, and a decisive turnover advantage. The official box score remains the best source for verifying individual statistics and comparing player performances.
1 thought on “Philadelphia Eagles vs Minnesota Vikings Match Player Stats”